Unlocking Business Insights with Salesforce Reports and Dashboard
Author
June 4, 2024
Reports and dashboards in Salesforce are powerful tools designed to help users analyze, visualize, and interpret data within the CRM platform. These tools play a crucial role in transforming raw data into meaningful insights, enabling informed decision-making and strategic planning.
In addition to their analytical prowess, Salesforce reports offer customizable data filters and sorting options, ensuring users can tailor their views to specific criteria. Dashboards further enhance the user experience by consolidating multiple reports and key performance indicators into a single, cohesive
interface.
To create a report in Salesforce, navigate to the ‘Reports’ tab, choose the desired report type, set
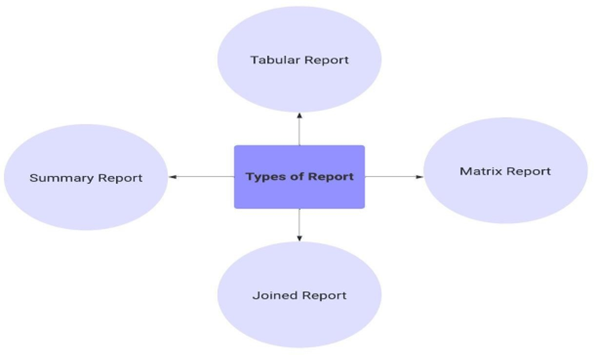
criteria, and follow the intuitive steps provided by the platform for customization and analysis. Please refer to FIG.
Types of Reports:
Salesforce offers a variety of report types, each serving specific analytical needs. Here are some common types:
1. Tabular Reports:
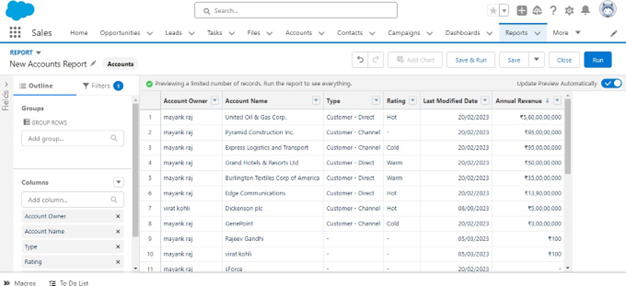
Tabular reports are the most straightforward type, presenting data in a table format. They provide a basic listing of records with columns that you can customize. These reports are used to list object records like account, opportunities, contacts, etc. Please Refer Fig
2. Summary Reports:
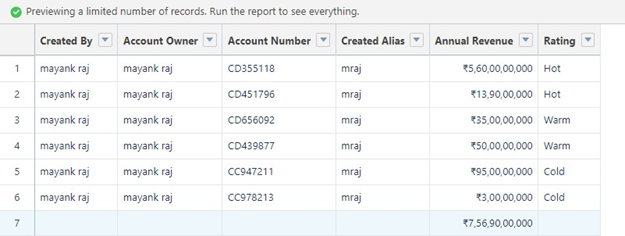
Summary reports aggregate data to provide a higher-level overview. They often include subtotals and grand totals, making them ideal for analyzing data at various levels of granularity. Please Refer Fig.
3. Matrix Reports:
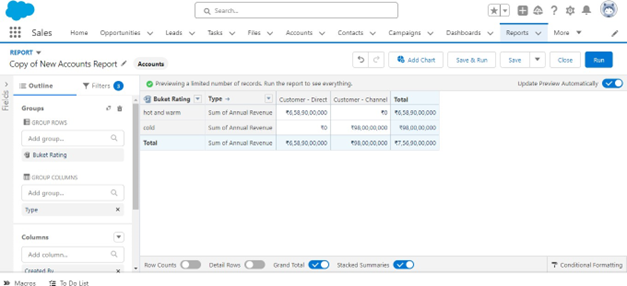
Matrix reports allow users to group and summarize data both vertically and horizontally. They provide a comprehensive view of information, making it easier to identify patterns and relationships. Please Refer Fig
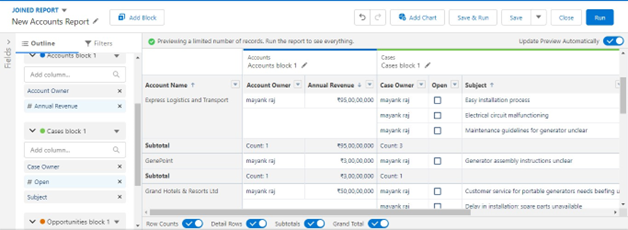
4. Joined Reports:
Joined reports merge data from multiple report types into a single view. A joined report allows you to show data that share a relationship with one or more objects. Joined reports become particularly useful in scenarios where objects lack a parent-child relationship, as is often the case with entities likeAccounts, cases and Opportunities. Please refer to Figure
Create a Custom Report Type:
Salesforce provides prebuild ready-to-use Report Types, which is awesome, but they might not cover every specific requirement you have. Unfortunately, you can’t tweak the preset Report Types directly.
However, you can create your own reports with Custom Report Types. These let you decide exactly what you want to see in terms of objects and fields.
When to Use Custom Report Types:
- No Standard Report Type:
- When the objects you want to report on don’t have a standard report type.
- When you need fields not found in regular report types.
- Flexible Field Handling:
- If you want to rename fields or make them more user-friendly without changing them everywhere.
- For creating a more user-friendly reporting experience.
Benefits of Custom Report Types:
- Multi-Level Connections:
- Custom report types allow you to link up to four levels of related objects. Imagine a report on Accounts with Opportunities, Contacts, and Tasks all in one go!
- Handle Objects with or without Records:
- Report on objects that might not have related records. For example, see Opportunities with or without Activities.
- Grabbing Extra Info:
- Easily pull in details from related objects. If you’re reporting on Cases, you can easily include details about related products or accounts.
- Tweak Field Names and Defaults:
- Make small changes like shortening field names or deciding which fields show up by default on reports.
Dashboards Introduction:
Dashboards in Salesforce serve as visual representations of key metrics and insights derived from
reports. They consolidate multiple reports onto a single screen, providing a comprehensive overview of an organization’s performance.
Components of a Dashboard:
Salesforce dashboards consist of dynamic components, such as charts and metrics, providing a visually intuitive snapshot of real-time sales and business data. Please Refer Fig
Reports: Dashboards are built on reports, which serve as the foundation for data visualization. Users can select relevant reports to display on the dashboard, allowing for a tailored representation of critical
information.
Charts and Graphs: Dashboards leverage a variety of chart types, such as bar charts, pie charts, and line graphs, to visually represent data. These visualizations make it easier to identify trends, anomalies, and patterns in the data.
Metrics and Key Performance Indicators (KPIs): Users can add metrics and KPIs to highlight specific values or performance indicators directly on the dashboard. This enables quick assessment of key business metrics without the need to delve into detailed reports.
Gauges and Indicators: Gauges and indicators provide a quick, visual representation of performance against predefined benchmarks or targets. They help users understand whether certain metrics are within acceptable ranges or require attention.
Filtering and Interactivity: Dashboards often include interactive elements, such as filters and drill-down options, allowing users to focus on specific subsets of data. This interactivity enhances the user experience and ensures that dashboards remain versatile and adaptable to changing needs.
Why Reports and Dashboards Are Essential:
- Data-Driven Decision Making: Reports and dashboards empower organizations to make informed decisions based on real-time data, fostering agility and adaptability.
- Visibility into Performance: Sales teams can track their progress, monitor pipeline health, and identify trends to optimize their strategies for achieving targets.
- Forecasting: Salesforce reports facilitate accurate sales forecasting by analyzing historical data, helping organizations plan effectively.
- Customization: Custom report types and dashboards allow businesses to tailor analytics to their specific needs, ensuring relevance and accuracy.
- Cross-Functional Insights: Reports and dashboards transcend departmental boundaries, offering insights that benefit various teams, including sales, marketing, customer support, and management.
- Efficiency and Productivity: With a centralized location for critical data, teams can access the information they need without sifting through multiple sources, saving time, and improving overall efficiency.
Report Limits:
Row and Grouping Limits:
- Summary reports and matrix reports are capped at 20 rows for preview, while tabular reports are limited to 50 rows.
- In Salesforce Classic, chart groups and values have specific limits, and in Lightning Experience, the number of chart groups is restricted to 2,000.
Data Display and Visualization:
- Reports and charts may not display the selected colors for picklist values if the report exceeds 2,000 rows.
- Matrix reports exceeding 2,000 rows won’t show details upon clicking.
Mobile and User Interface:
- Reports with groupings may be converted to tabular format in the Salesforce mobile app.
- The Salesforce mobile app supports a maximum of 25 report columns. Filtering and Search:
- Filter criteria are limited to 1,333 characters, including commas used as OR operators.
- Long text area field searches are restricted to the first 1,000 characters.
Dashboard Limits:
Widget and Component Limits:
- Each dashboard can have up to 25 widgets, with specific limits on chart types and images.
- Dashboards with multiple components based on different report types may have filtering restrictions.
Dynamic Dashboard Limits:
- The allowable number of dynamic dashboards varies based on Salesforce Editions: Enterprise Edition accommodates up to 5, while Unlimited and Performance Editions support 10. In the case of Developer Edition, a maximum of 3 dynamic dashboards is permitted.
- You can’t save a dynamic dashboard in a private folder.
- You can’t schedule refresh for dynamic dashboards.
Conclusion:
Salesforce reports and dashboards are integral components of modern business operations, providing a comprehensive and intuitive approach to data analysis. As organizations strive to stay competitive and agile, leveraging these tools becomes essential for unlocking valuable insights that drive success in today’s fast-paced business environment.
Pranshu Goyal, Director of Products at Mirekta, states: “We envision DSM to be used by every small to a medium-sized organization dealing with bad data and want to get rid of duplicates easily with no cost. We have faced issues dealing with duplicates in our organization. That inspired us to make a solution that is not only simple to use but can be used widely to make the organization’s data clean to make them more efficient and productive. We want DSM to be a solution for every organization looking for duplicate management capability better than the Salesforce out-of-the-box solution with no additional cost.”
Recent Posts
-
The Hybrid Advantage in Salesforce QA20 May 2026 Blog -
CI/CD in Salesforce: Role of QA in DevOps Pipeline19 May 2026 Blog -
Reasons Why Addiction Treatment Centers should consider leveraging Salesforce as a CRM18 May 2026 Blog -
Insights on employee engagement15 May 2026 Blog -
AI Governance Why Businesses Need an AI Strategy Before Implementing AI14 May 2026 Blog -
Salesforce Agentforce: Revolutionizing AI with Autonomous Agents13 May 2026 Blog -
Salesforce Headless 360 Guide | Mirketa13 May 2026 Blog -
Salesforce Custom Permissions12 May 2026 Blog -
Salesforce Education Cloud – Time is Now11 May 2026 Blog -
Top Salesforce Performance Optimization Techniques for Large Enterprises08 May 2026 Blog -
AI Orchestration for Enterprises: Scale Smarter, Faster, and Securely08 May 2026 E-Book -
Stress is always on a vacation @ Mirketa08 May 2026 Blog -
UiPath RPA with AI Capabilities in Salesforce07 May 2026 Blog -
The ROI of AI in Enterprise Applications06 May 2026 Blog -
Rethinking Enterprise Quoting in Salesforce28 Apr 2026 Blog -
Integration Testing with Data Warehouse27 Apr 2026 Blog -
Salesforce Nonprofit Cloud vs NPSP: 2026 Comparison Guide24 Apr 2026 Blog -
Top Use Cases of Salesforce Experience Cloud for Businesses23 Apr 2026 Blog -
How Salesforce Nonprofit Cloud is Transforming Fundraising, Grant Management & CRM in 202622 Apr 2026 Blog -
Get Proactive with Salesforce-Mirketa’s Vaccine Cloud Solutions19 Apr 2026 Blog